Is it Random: The Probability of Rolling Dice
Abstract: In this experiment, I roll 2 dice 100 times and record the sums of each trail. I analysis the data of the simple rolling dice experiment to see if my hypothesis was correct. After checking our hypothesis, we compare the results to another similar study.
Sakib Amin
March 21, 2019
Introduction:
In this experiment we will be doing a simple dice rolling to determine the probability of obtaining each outcome. We will have 2 six-sided dice in this experiment and for most people they would think that there was an equal chance of getting each outcome; however, that is not true. Since each dice has 6 sides there are 36 different arrangement of numbers but, there are only 11 possible combined sums that the dice could have. This happens, because certain numbers add up to the same sum. For example, if you roll a 2 and another 2 you get an outcome of 4. Then you roll the dice again and you get a 1 and a 3 which gives u an outcome of 4 as well. If we look at all 11 possible combined sums using probability we can see that the chance of obtaining each sum is a bell curve. With this in mind, I can hypothesis that if I roll the 2 dices 100 times then the sums of each roll will be normally distributed as a bell curve.
Materials:
- 2 dice
- Paper and Pencil
Methods:
- Take the dice and roll it and record the numbers on each dice on the sheet of paper.
- Repeat step 1 for 100 times.
- Calculate the sums of each trial
Results:
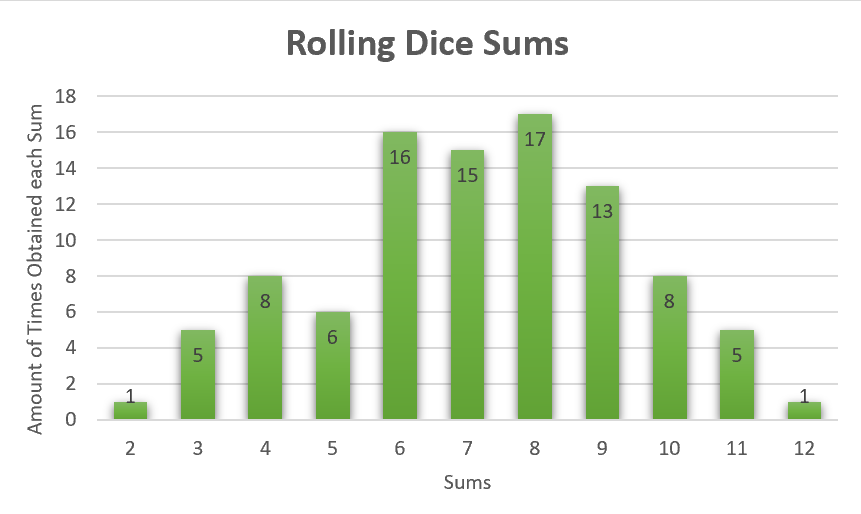
Figure 1: This is a bar graph showing the amount of times each sum was obtained from out 100 trial experiment.
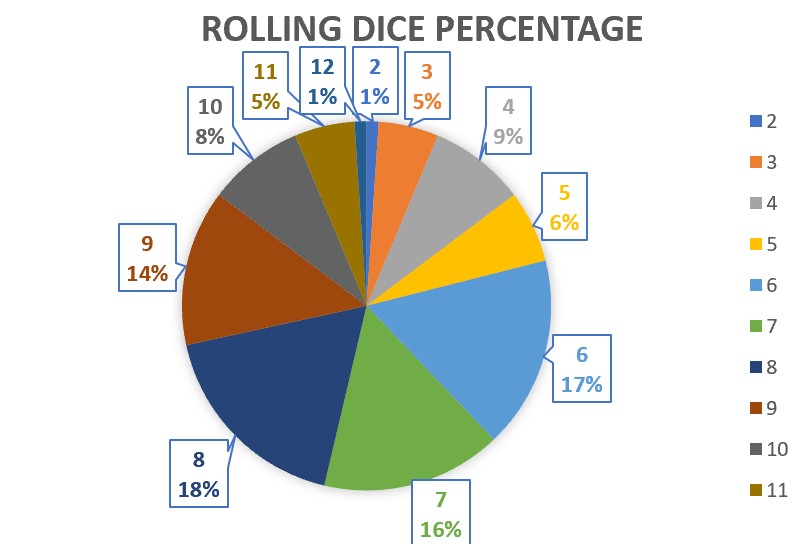
Figure 2: This is a pie chart show the percentage of the number of times each sum was obtained from out 100 trial experiment
Analysis:
After conducting our experiment, I can say that our hypothesis was correct. I hypothesized that if I rolled the dice 100 times then the sums of each trial would be normally distributed as a bell curve. Looking at Figure 1 we can see that it is fairly true. If we were to draw a line going along the top of each bar we would get something that resembled a bar graph. We do have small outliers with the sum of 5 and 7 but this can be attributed to the lack of trials. If we were to do 100 more trails the results would look even more like the bell curve, we were trying to achieve. This is because with more trials it will bring more consistency and eliminate random chance within our experiment.
Donald R. Smith and Robert Scott III, who are professors at Monmouth University performed an experiment to determine the amount of control a craps shooter must possess on dice outcomes. This experiment is far more complexed than what we performed but, in the experiment, they did come to the conclusion of all combinations and probabilities of dice rolls. If you look at figure 4 in the appendix you can see that the probabilities of each number are very similar to the percentages, we obtained in figure 2. Figure 2 was made with the same set of datapoints used in figure 1 but it shows a better breakdown of the probabilities of each sum.
Conclusion:
I can say with confidence that this experiment was successful. I designed this experiment to test the probability of rolling two dice and we predicted that the probability would be like a bell curve and that hypothesis was correct when I analyzed the results. It was very close to a bell curve with small outliers that can be accounted for due to the lack of trials. As I stated before to make this experiment better you would need to do more trials, but you can use the results to expand and perform other experiments. For example, most board games tend to use dice and with this experiment we can determine the chance to win a certain game. Another experiment we could probably do is with a dice that has more sides to it and compare those results to the results we obtained in this experiment. These are just somethings a simple experiment like this can build upon, but the possibilities are endless.
Work Cited Page:
Smith III, R., & Smith, D. R. (n.d.). Golden Arm: A Probabilistic Study of Dice Control in Craps.
UNLV Gaming Research & Review Journal, 22(1), 29-36. Retrieved March 20, 2019, from https://digitalscholarship.unlv.edu/cgi/viewcontent.cgi?article=1375&context=grrj.
Appendix:
Figure 3: This is all the datapoints used to create Figure 1 and Figure 2.
| Trial | Dice 1 | Dice 2 | Sum |
| 1 | 4 | 4 | 8 |
| 2 | 6 | 4 | 10 |
| 3 | 2 | 3 | 5 |
| 4 | 1 | 2 | 3 |
| 5 | 5 | 5 | 10 |
| 6 | 3 | 6 | 9 |
| 7 | 5 | 1 | 6 |
| 8 | 3 | 2 | 5 |
| 9 | 4 | 1 | 5 |
| 10 | 3 | 6 | 9 |
| 11 | 4 | 1 | 5 |
| 12 | 3 | 6 | 9 |
| 13 | 3 | 4 | 7 |
| 14 | 5 | 5 | 10 |
| 15 | 2 | 5 | 7 |
| 16 | 1 | 6 | 7 |
| 17 | 4 | 4 | 8 |
| 18 | 4 | 3 | 7 |
| 19 | 6 | 5 | 11 |
| 20 | 5 | 5 | 10 |
| 21 | 2 | 1 | 3 |
| 22 | 4 | 3 | 7 |
| 23 | 5 | 3 | 8 |
| 24 | 3 | 5 | 8 |
| 25 | 4 | 2 | 6 |
| 26 | 4 | 3 | 7 |
| 27 | 4 | 1 | 5 |
| 28 | 4 | 5 | 9 |
| 29 | 5 | 4 | 9 |
| 30 | 3 | 1 | 4 |
| 31 | 3 | 1 | 4 |
| 32 | 5 | 6 | 11 |
| 33 | 5 | 5 | 10 |
| 34 | 1 | 5 | 6 |
| 35 | 5 | 3 | 8 |
| 36 | 3 | 6 | 9 |
| 37 | 3 | 3 | 6 |
| 38 | 4 | 1 | 5 |
| 39 | 3 | 4 | 7 |
| 40 | 6 | 1 | 7 |
| 41 | 3 | 5 | 8 |
| 42 | 4 | 2 | 6 |
| 43 | 1 | 3 | 4 |
| 44 | 5 | 2 | 7 |
| 45 | 1 | 3 | 4 |
| 46 | 3 | 1 | 4 |
| 47 | 1 | 4 | 5 |
| 48 | 2 | 1 | 3 |
| 49 | 3 | 5 | 8 |
| 50 | 6 | 5 | 11 |
| 51 | 3 | 3 | 6 |
| 52 | 5 | 6 | 11 |
| 53 | 3 | 3 | 6 |
| 54 | 6 | 3 | 9 |
| 55 | 3 | 1 | 4 |
| 56 | 6 | 5 | 11 |
| 57 | 3 | 1 | 4 |
| 58 | 2 | 1 | 3 |
| 59 | 2 | 5 | 7 |
| 60 | 6 | 1 | 7 |
| 61 | 2 | 6 | 8 |
| 62 | 5 | 1 | 6 |
| 63 | 4 | 4 | 8 |
| 64 | 6 | 4 | 10 |
| 65 | 4 | 3 | 7 |
| 67 | 3 | 2 | 5 |
| 68 | 3 | 4 | 7 |
| 69 | 5 | 3 | 8 |
| 70 | 3 | 5 | 8 |
| 71 | 1 | 2 | 3 |
| 72 | 5 | 4 | 9 |
| 73 | 2 | 5 | 7 |
| 74 | 3 | 6 | 9 |
| 75 | 1 | 5 | 6 |
| 76 | 3 | 3 | 6 |
| 77 | 4 | 5 | 9 |
| 78 | 4 | 4 | 8 |
| 79 | 1 | 1 | 2 |
| 80 | 4 | 2 | 6 |
| 81 | 2 | 4 | 6 |
| 82 | 3 | 6 | 9 |
| 83 | 3 | 3 | 6 |
| 84 | 6 | 2 | 8 |
| 85 | 4 | 1 | 5 |
| 86 | 6 | 4 | 10 |
| 87 | 1 | 6 | 7 |
| 88 | 5 | 1 | 6 |
| 89 | 4 | 5 | 9 |
| 90 | 5 | 3 | 8 |
| 91 | 2 | 3 | 5 |
| 92 | 4 | 2 | 6 |
| 93 | 6 | 3 | 9 |
| 94 | 2 | 6 | 8 |
| 95 | 2 | 2 | 4 |
| 96 | 4 | 2 | 6 |
| 97 | 3 | 5 | 8 |
| 98 | 6 | 6 | 12 |
| 99 | 5 | 3 | 8 |
| 100 | 6 | 4 | 10 |
Figure 4: This table shows the combination of probabilities of a dice roll from the Golden Arm: A Probabilistic Study of Dice Control in Craps.